John Finlay Group Of Companies

Aadil Keshwani

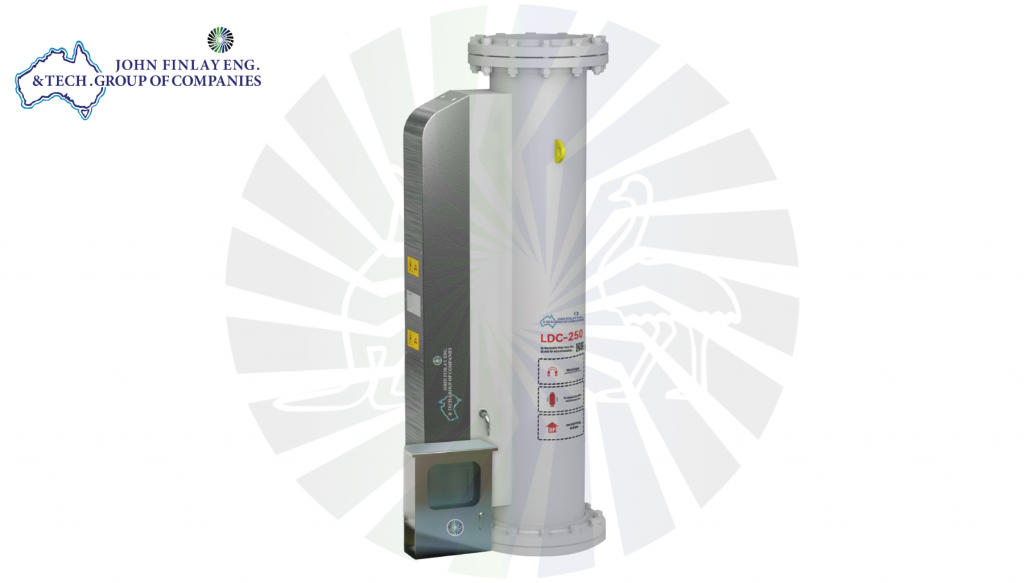
LDC Series intelligent non-nucleonic slurry density meter by John Finlay Engineering for coal washery and mineral processing

Density Control in the Media Loop

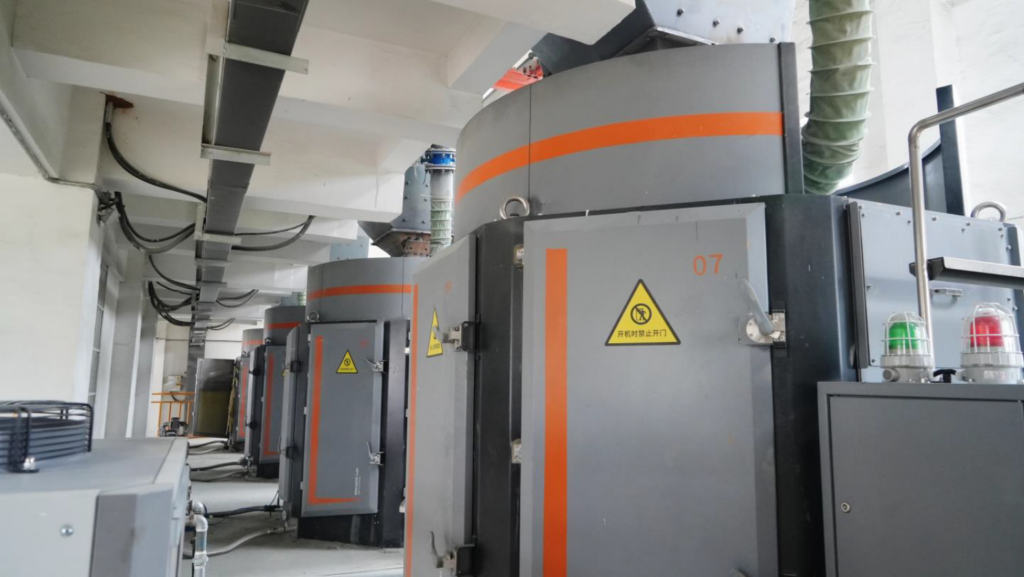
Density Control in the Media Loop: What to Measure and Why It Drifts Every dense medium circuit runs on one number more than any other: medium density, usually held to a target specific gravity within a narrow band. Get that number right and the circuit does what it was designed to do. Let it drift, and the effects show up as yield loss and ash penalties before anyone traces the cause back to density control, usually because a plant is checking density less often and less precisely than the number actually needs. It’s also one of the more straightforward instrumentation decisions in a coal washery. Unlike a lot of process changes that require weighing tradeoffs, continuous density measurement at the right points has a fairly direct case: the technology is mature, the installation is routine, and the payback tends to be short once the numbers are actually run for your own plant. Where Density Should Be Measured Most washeries measure density somewhere in the medium loop. Few measure it everywhere the loop actually needs it. Feed density to the cyclone is the measurement that matters most, because it directly sets the cut point. A single continuous reading upstream of the cyclone, rather than a periodic manual sample, is the minimum viable setup, but it only tells you what’s entering the cyclone, not what’s happening to the medium once it’s inside. Underflow and overflow density, measured separately, close the loop. Comparing underflow density against feed density tells you whether the medium is behaving the way the cyclone geometry assumes it should; a widening or narrowing gap between the two is often the earliest sign of a problem elsewhere in the circuit, well before it shows up in yield or ash figures. The dilution water addition point is the fourth place worth instrumenting because that’s where most density corrections actually get made manually, in many plants, based on the same feed density reading the operator is trying to correct in the first place. Why the Number Drifts Density drift usually comes from multiple causes. A few show up repeatedly. Dilution water balance is the most common. Excess water enters the circuit through spray systems, washdown, or upstream process water, diluting the medium; the standard response is to add more magnetite to compensate rather than fixing the water balance itself. We’ve covered this specific failure mode in detail in our post on magnetite consumption benchmarks. Density drift and magnetite consumption often have the same root cause, showing up as two different symptoms. Magnetite quality also drives density drift, independent of water balance. Off-spec magnetite with the wrong SG and wrong particle size changes how much solids loadinis needed to hold a given medium density, sons an operator correcting density based on a fixed magnetite addition rate is chasing a moving target. We go into the specification numbers that matter here in a separate post on magnetite granulometry. Instrument drift itself is worth ruling out before assuming the process is at fault. Density meters need periodic calibration checks; a meter reading consistently high or low by a fixed offset looks identical, on a trend chart, to a genuine process drift. Sensing line blockage or buildup gradually skews readings without an obvious failure event; the meter keeps reporting a number, just not the right one. None of these causes are mutually exclusive, and on plants that have been running the same instrumentation setup for years without review, it’s common to find two of them compounding a water balance issue masked by a meter that’s also drifted out of calibration, for instance, with each one making the other harder to diagnose from the trend data alone. Four points worth measuring in the medium loop What Drift Actually Costs The mechanism is straightforward even when the number is specific to your plant. A shift in medium SG moves the cut point, and moving the cut point either sends coal that should have reported to product into the reject stream, a direct yield loss, or lets higher-density, higher-ash material through to product, showing up as a quality penalty on every tonne shipped rather than a single dramatic event. Because the effect is gradual and distributed across every tonne processed rather than concentrated in an obvious failure, density drift is one of the easier problems to underprice. A 50 kg/m³ drift sustained over a full shift affects every tonne that shift processes, not just a batch. Density drift is also only half of what determines separation performance; the other half is how sharp that separation is at whatever cut point you’re holding, which is a function of the cyclone itself rather than the medium loop. We cover the mechanical side of that in our post on cut point control in heavy media cyclone circuits. The Payback Arithmetic Continuous, correctly located density instrumentation is inexpensive relative to what it protects. The comparison is worth running for your own plant: take your current yield or ash variance attributable to density drift, even a rough estimate from your own QC data; value it against your realization price; and compare that monthly figure against the cost of a properly specified density meter at the points that actually matter. For most plants, the payback period on closing that gap is short, which is part of why this is one of the more straightforward equipment decisions in a coal washery; the case tends to make itself once the numbers are actually run, rather than needing to be argued. How John Finlay Helps Getting density instrumentation right starts with placing it at the points in the loop that actually drive the cut point, not just wherever’s convenient to install. John Finlay’s Intelligent Slurry Density Meters are built for exactly this continuous, real-time monitoring feeding directly into the same automation layer as our Dense Media Cyclones and Magnetic Separators. If you’re not sure where your circuit’s biggest density blind spot is, our engineers can walk your loop with you and point to it directly. Not sure
Density Control in the Media Loop Read More »

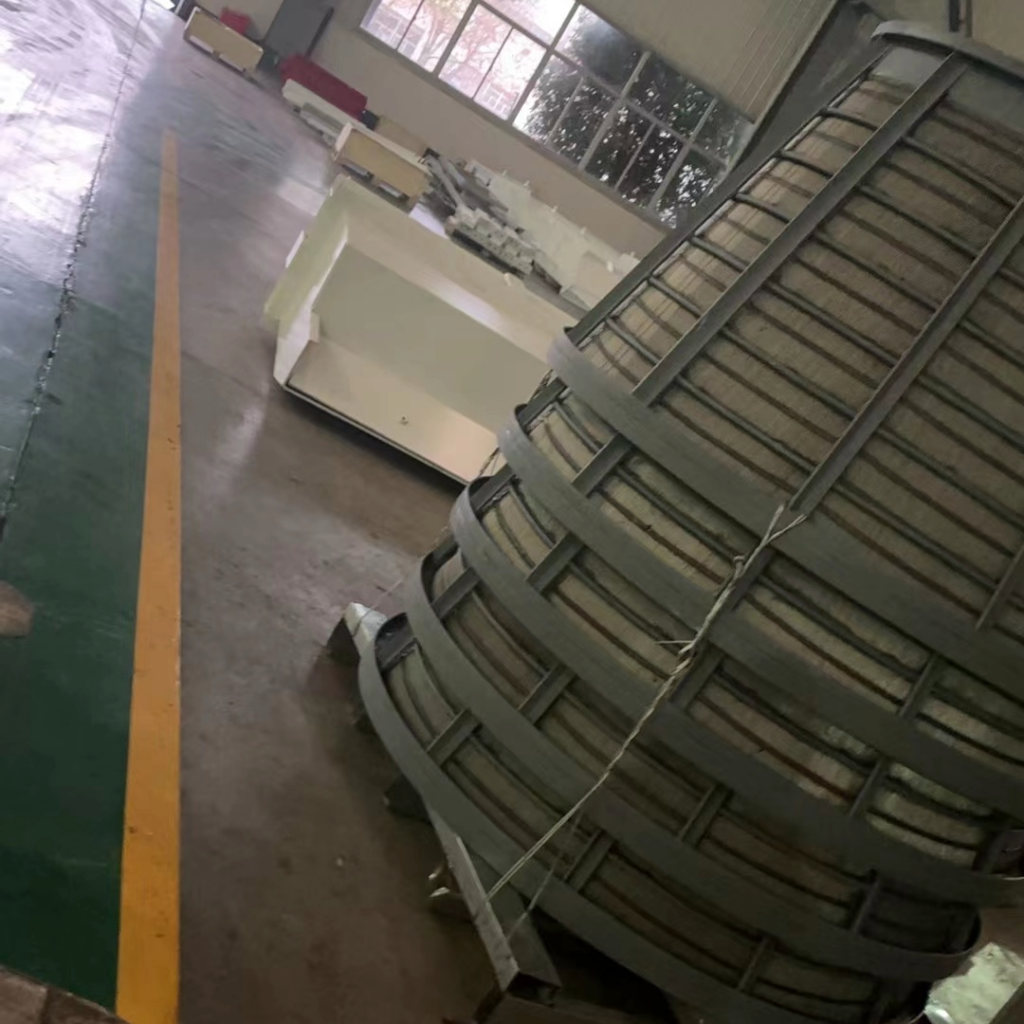
Basket centrifuge screen assembly, coal dewatering, John Finlay manufacturing facility

Tailings Dewatering: Filter Press, Belt Filter Press or Centrifuge?

Tailings Dewatering: Filter Press, Belt Filter Press or Centrifuge? Product moisture is the number that follows a coal washery out the gate. Ash and yield get negotiated in the contract; moisture gets measured on every single truck, and it’s the one quality parameter where the dewatering circuit, not the washing circuit, does almost all of the work. Three technologies do that job on most Indian coal washeries: filter presses, belt filter presses, and centrifuges. They’re not interchangeable. Each one is built for a different fraction of the plant’s solids, and picking the wrong one for a given stream is a common way to end up with a dewatering circuit that’s technically working and still not hitting spec. Feed moisture (avg) % Product moisture (avg) 0 % Reduction, held over 8hr run 7– 0.03 pt Model tested FLL- 1000 WZ What Each Technology Is Actually For Centrifuges handle coarse and fine coal where speed and continuous operation matter. A basket centrifuge spins the wet coal against a slotted or wedge-wire screen basket, using centrifugal force to drive free water through the screen while the solids are held against the wall. It’s a continuous, high-throughput process, which is why it’s the standard choice for dewatering the main clean coal product stream rather than a batch process sitting in the middle of a continuous plant. Filter presses handle the opposite end of the particle size range fine tailings and slurry that centrifuges can’t dewater efficiently, because very fine particles pass through or blind a centrifuge screen faster than they dewater. A plate and frame filter press forces the slurry through filter cloth under pressure, building a solid cake between the plates before the cycle ends and the cake discharges. It’s a batch process by nature, and it’s the technology that makes zero-discharge tailings handling realistic, because the cake it produces is dry enough to stack or truck rather than pump to a pond. Belt filter presses sit between mechanisms, not necessarily based on particle size. Sludge is conditioned with a flocculant, then carried between two porous belts through a series of rollers that apply progressively increasing pressure, squeezing water out continuously as the belts travel. Unlike a filter press, it never stops to discharge a batch; the cake comes off continuously at the end of the belt run. That makes it suited to sites that need continuous tailings dewatering at moderate throughput without the cycle-time constraints of a batch press. Why the Choice Isn’t Interchangeable The three technologies fail differently when applied to the wrong stream, which is usually the fastest way to tell whether a plant has the right one. A centrifuge fed material that’s too fine loses efficiency fast; the fines migrate through the screen slots instead of being retained, so effluent solid losses climb and the dry product moisture that was supposed to drop stays stubbornly high. This scenario is a common cause of centrifuges getting blamed for a moisture problem that actually started upstream, in whatever’s feeding fines into a stream the centrifuge was never sized for. A filter press fed a stream that’s too coarse or too dilute cycles inefficiently. Coarse particles don’t build a cake the way fine slurry does, and a dilute feed just extends cycle time for the same cake yield, cutting the plant’s effective throughput without anyone changing a setpoint. A belt filter press asked to handle a stream with highly variable solids loading struggles to hold a consistent cake because the roller pressure profile is set for a given feed consistency; a sudden slug of solids either overwhelms the belt or passes through under-conditioned. Matching the technology to the actual particle size and throughput profile of the stream being dewatered, rather than to whatever’s already installed, is what most often separates a dewatering circuit that hits spec from one that is fighting its equipment. What Real Performance Looks Like Numbers from an actual plant are more useful here than manufacturer ranges. On an eight-hour test run of a horizontal vibrating basket centrifuge processing combined clean and middling coal, feed moisture averaged 22% and product moisture averaged 15%; a 7 to 8 percentage point reduction held consistently across the full run, with bearing temperatures and vibration amplitude staying within normal operating range throughout. That’s the kind of result that makes a centrifuge the right call for a clean coal stream: consistent, continuous, and stable over a full shift rather than degrading as the run goes on. That same consistency is the test worth applying to any dewatering technology under consideration. A single reliable reading doesn’t confirm a technology choice. A full shift of stable readings does. Wedge-wire screen basket centrifuge, John Finlay manufacturing facility Getting the Most Out of What’s Already Installed Before assuming a technology swap is the answer to a moisture problem, it’s worth checking whether the installed equipment is actually running at its design point. Centrifuge performance is sensitive to the condition of the basket screen. Slots that have worn open lose their retention efficiency long before the basket looks visibly damaged, and vibration amplitude that’s drifted from its set point changes both throughput and product moisture at the same time. The cycle time of the filter press is sensitive to chemical conditioning upstream; a flocculant dose that’s drifted off its optimum will extend every cycle even if the press itself is mechanically sound. The consistency of the belt press cake depends on roller pressure staying matched to actual feed solids, which changes as upstream circuits change. Most moisture complaints labeled as “we need bigger equipment” actually result from mismatched feed conditions and setpoints, rather than any capacity shortfall. Choosing for Your Actual Stream Start with what’s actually in the stream you’re trying to dewater: the particle size distribution, the solids concentration, and how much those vary from shift to shift. A clean coal product stream with coarse-to-mid particle size and continuous flow points toward a centrifuge. A fine tailings stream that needs to go to dry stack rather than

Tailings Dewatering: Filter Press, Belt Filter Press or Centrifuge? Read More »

Coal Washery Magnetic Recovery Equipment Magnetic Separator for Coal Washery

Magnetite Consumption in Dense Medium Circuits: Benchmarks and How to Diagnose Yours

Magnetite Consumption in Dense Medium Circuits: Benchmarks and How to Diagnose Yours Every dense medium circuit consumes magnetite. The number that actually affects your operating cost isn’t whether it consumes magnetite; it’s how much it should consume and whether your circuit’s real figure is close to that or has quietly drifted away from it. For a correctly specified low-intensity wet drum separator, that benchmark sits close to 800 grams of magnetite per tonne of ROM coal washed. That figure comes from our own 2024 technical work on magnetite recovery in Indian coal duty, and it holds for circuits where the drum, the launders and the screens are all doing what they’re designed to do. It isn’t a theoretical minimum reserved for a perfect plant on a good day. Correctly running circuits sit on it. Most plants don’t. Ask five washery managers what their circuit consumes and you’ll usually get five different numbers, most of them well above 800 g/t, and almost none of them broken down by cause. That’s the real problem. Not that consumption is so high that nobody can say why. Magnetite is also one of the few genuinely controllable variable costs in a dense medium circuit. Coal quality is what it is. Throughput is set by the plant’s design and the market. Magnetite consumption, on the other hand, is almost entirely a function of how well the circuit is running, which means it’s one of the fastest places to find real savings without touching capacity or product spec. It matters more in Indian coal duty than the number alone suggests. Higher ash content and larger near-gravity fractions put more physical load through the medium circuit per tonne washed than many imported coals do, which makes the discipline around magnetite recovery worth more here, not less. A circuit that’s leaking magnetite on an easy coal is expensive. The same leak on a difficult Indian coal is worse because the circuit is already working harder to hold separation efficiency. Where The Number Actually Goes The arithmetic is straightforward once you have your number. Take the difference between what your circuit actually consumes and the 800 g/t benchmark, multiply it by tonnes of ROM washed, and multiply it by your delivered magnetite price. That’s what the gap is costing, every month, independent of anything else that might be off in the circuit. It’s rarely one cause on its own. Most circuits we’ve looked at closely turn out to have two or three loss points running at the same time, each one modest by itself, together adding up to a consumption figure that looks unremarkable until it’s actually benchmarked against what the circuit is capable of. A magnetic separator recovering to its rated efficiency is the foundation the rest of this diagnosis depends on. Every other loss point on this list is easier to isolate once you know the drum itself isn’t the source. If your separator hasn’t been checked against rated recovery performance recently, that’s where you should begin. None of this requires shutting the circuit down to find out. A shift-length mass balance, a tailings sample, and an honest look at your density trend will tell you within a day whether you’re close to 800 g/t or carrying a gap worth chasing and roughly which of the five loss points above is the likely cause. Diagnosing Your Own Number Before making any changes to the circuit, please establish your current position. Run a magnetite mass balance over a full shift, comparing the mass of magnetite added to the tonnes of ROM washed in that same shift, rather than relying on monthly purchase records averaged against monthly throughput. Monthly figures smooth out exactly the upsets you’re trying to find. Check the magnetic separator tailings directly. A bucket sample and a hand magnet will tell you, qualitatively and quickly, whether magnetite is riding out with the reject in a way that shouldn’t be happening. If it is, the drum is your starting point for investigation, not the makeup rate. Sample what’s leaving on the product and discard screens, not only what’s leaving in the tailings stream. Carryover on clean coal is invisible unless someone specifically checks for it, and it’s one of the more common blind spots on sites that only monitor the obvious loss points. Track medium density against a setpoint across a full shift rather than relying on a single spot check. A circuit that chronically runs under density and receives fresh magnetite additions has a dilution problem disguised as a magnetite consumption problem. Separate consumption from loss. Some magnetite leaves the circuit because it’s genuinely degraded past the point of recovery for its consumption, and better magnetite quality addresses it. Some leave because a piece of equipment isn’t performing to specification; that’s a loss, and no amount of premium magnetite fixes it. Sites that treat both the same way keep buying their way around mechanical problems. What Closing The Gap Is Worth Before making any changes to the circuit, please establish your current position. Run a magnetite mass balance over a full shift, comparing the mass of magnetite added to the tonnes of ROM washed in that same shift, rather than relying on monthly purchase records averaged against monthly throughput. Monthly figures smooth out exactly the upsets you’re trying to find. Check the magnetic separator tailings directly. A bucket sample and a hand magnet will tell you, qualitatively and quickly, whether magnetite is riding out with the reject in a way that shouldn’t be happening. If it is, the drum is your starting point for investigation, not the makeup rate. Sample what’s leaving on the product and discard screens, not only what’s leaving in the tailings stream. Carryover on clean coal is invisible unless someone specifically checks for it, and it’s one of the more common blind spots on sites that only monitor the obvious loss points. Track medium density against a setpoint across a full shift rather than relying on a single spot check. A circuit

Magnetite Consumption in Dense Medium Circuits: Benchmarks and How to Diagnose Yours Read More »

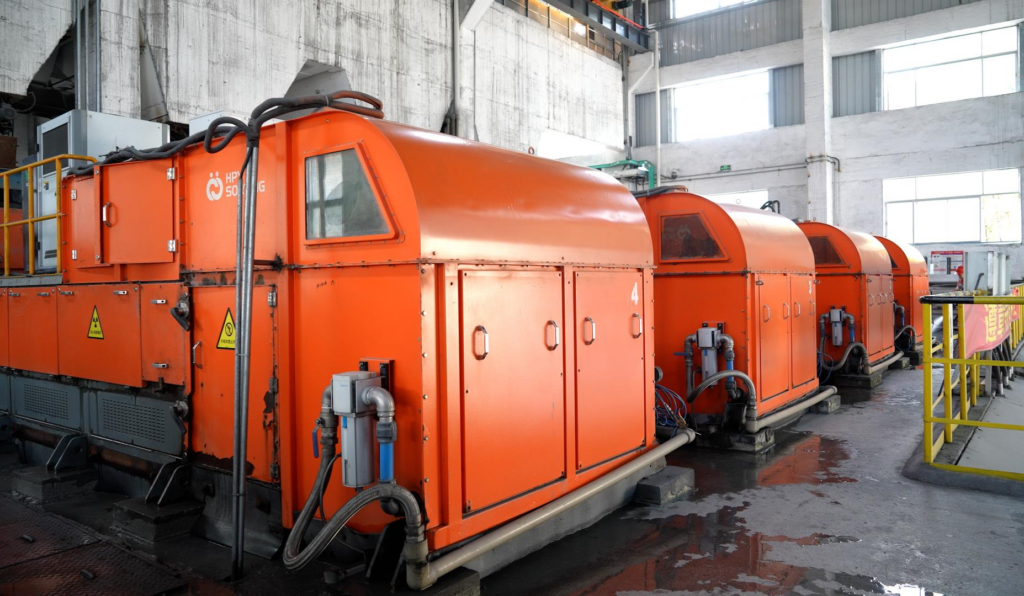
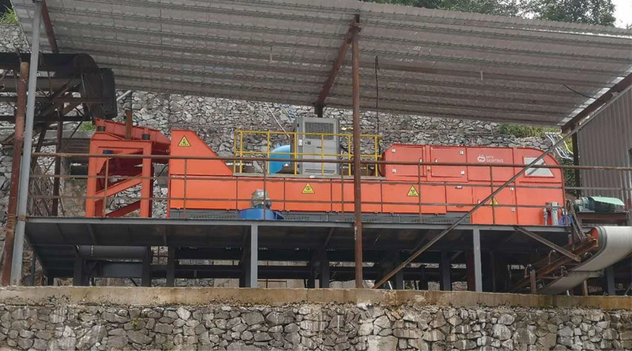
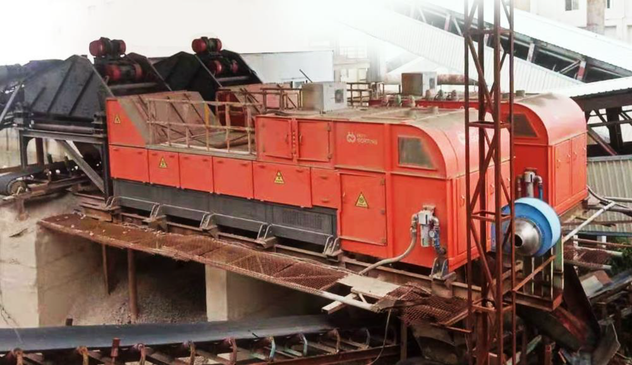
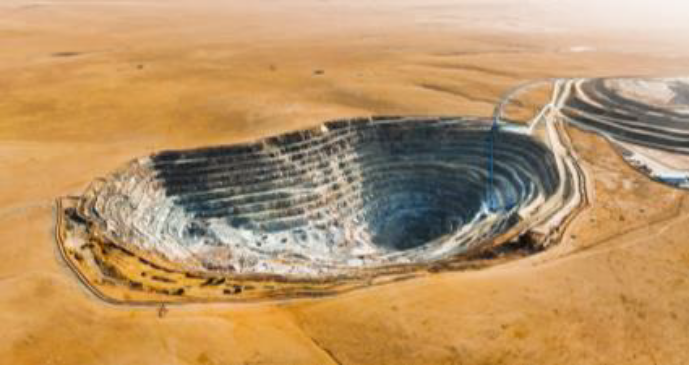
Molybdenum ore processing plant with sensor-based ore sorting equipment, Luanchuan, China

Molybdenum Ore Sorting Case Study: 42% Waste Rejection with 86.1% Recovery

Molybdenum Ore Sorting Case Study: 42% Waste Rejection with 86.1% Recovery Circle Series Pre-Concentration at Hengyu Molybdenum Mine Luanchuan Hengyu Mining Co., Ltd. operates the Hengyu Molybdenum Mine, a 6,500 t/d operation that processes ore with a raw grade of just 0.046% molybdenum. At that grade, every ton of waste rock that reaches grinding and flotation carries a real cost in power, reagents, and tailings capacity spent on material that will never yield metal. John Finlay delivered this cost installation, fitting four Circle Series sorters to pull that waste out before it gets there. Project Overview Operator Luanchuan Hengyu Mining Co., Ltd. Site Hengyu Molybdenum Mine Ore Type Molybdenum Feed Material +10–45mm, raw ore grade 0.046% Mo Processing Capacity 6,500 t/d Challenge Low-grade ore means most run-of-mine tonnage is waste; sorting it out before grinding and flotation protects downstream capacity and reagent cost Solution Four Circle Series ring-shaped sorters were installed to pre-concentrate the +10–45mm fraction ahead of the beneficiation circuit, rejecting barren rock while holding onto the mineralized fraction for further processing. Equipment and Performance 1. Sensor-Based Pre-Concentration● Machines Used: Machines Used: Four Circle Series C1500 units● Processing Capacity: 6,500 t/d● Function: Removes low-grade waste rock from +10–45mm feed ahead of grinding and flotation Sorting Results ● Raw Ore Grade: 0.046% Mo● Concentrate Grade: 0.079% Mo● Waste Rock Grade: 0.018% Mo● Rejection Rate: 42%● Recovery Rate: 86.1%● Enrichment Ratio: 1.72 Benefits and Outcomes ●  Economic Efficiency: Rejecting 42% of feed before grinding and flotation cuts the tonnage those downstream stages need to process, lowering power and reagent cost per tonne of contained molybdenum recovered. ● Environmental Impact: Waste rock pulled out at the sorting stage reduces the volume reaching tailings storage. ● Operational Efficiency: Lifting ore grade from 0.046% to 0.079% before flotation, a 1.72x enrichment, gives the downstream circuit a more consistent, higher-grade feed to work with. Conclusion At Hengyu, four Circle Series sorters turn a low-grade 0.046% Mo ore body into a workable feed by rejecting 42% of run-of-mine tonnage while holding 86.1% of the contained molybdenum. The result is a 1.72x grade lift before the ore ever reaches flotation, the kind of pre-concentration that makes marginal-grade deposits easier to run economically. Considering pre-concentration for a molybdenum, copper, or polymetallic operation? Talk to John Finlay’s ore sorting team about a feasibility assessment for your ore body. Request a Feasibility Assessment

Molybdenum Ore Sorting Case Study: 42% Waste Rejection with 86.1% Recovery Read More »

Why 98% Recovery Rates Matter

Your washery loses 15–25% of coal every day to the slurry pond. Here’s how four Indian mines recovered it and why the engineering matters. Every Indian coal washery faces the same problem Every Indian coal washery faces the same problem: coal loss in the slurry pond. At a typical SECL or BCCL washery processing 1,000 tonnes per day, that’s 150–250 tonnes of coal disappearing daily. Over a year, that’s 55,000–90,000 tonnes of coal worth ₹4–7 crore in lost revenue. And that’s before counting the cost of managing tailings, extending pond life, and grinding ore further downstream to make up for lost coal. Most washeries accept these losses as inevitable. The dense media cyclone captures what it can, but the fine coal fraction (-1 mm) and near-gravity material escape. Heavy media bath loses magnetite. Flotation cells clog. Until now, the engineering toolset hasn’t really changed in 30 years. But what if 98% recovery were possible? Not theoretical. Not after massive capex. But in 18 months, using existing equipment at four operating mines across India, two in Chhattisgarh, one in Jharkhand, and one in Odisha, this is what sensor-based dry coal sorting achieved. This is what sensor-based dry coal sorting achieved. And the implications shift how you think about coal beneficiation economics. How loss happens Traditional washery loss occurs at three points. Dense media cyclones work on density difference, but coal density overlaps with gangue (near-gravity material). About 5–10% of coal reports to the waste stream. Desliming screens remove fine material, but −1mm coal is economically valuable in power plants and coking; it shouldn’t go to tailings. Flotation cells recover some coal, but when the ash content exceeds 30%, which is common in Indian ROM coal, flotation efficiency declines. The root cause: You’re asking chemistry (flotation, dense medium density) to do what physics (X-ray density imaging, machine vision + air jet precision) does better. Your washery is good at bulk separation, but it is not designed for fine, near-gravity sorting. This limitation is not designed for fine, near-gravity sorting. This is why recovery plateaus at 85–88% at most coal washeries in India, even well-run ones. The sensor-based solution Sensor-based dry coal sorting combines three technologies. Sensor-based dry sorting combines XRT imaging, machine vision and pneumatic separation to identify coal and gangue in real time.  XRT imaging: X-ray transmission scans each coal lump (−50mm to +300mm) at 1.5 millisecond intervals. XRT detects density differences as small as 0.05 g/cm³, separating coal (1.2–1.5 g/cm³) from gangue (2.6+ g/cm³) and magnetite (5.0+ g/cm³) with a precision a dense media bath can’t achieve. Machine vision: HD and 8K cameras capture surface features, color, and texture. This combination catches coal that XRT alone might miss (oxidized surfaces, coal-like mineralization). Two imaging modes together improve accuracy from 92% to 99.5%. AI-assisted identification improves sorting accuracy by combining density analysis with machine vision.  AI algorithm: A convolutional neural network (the Wenshu algorithm in HPY systems) processes XRT + vision data in real-time, predicting coal vs. gangue vs. magnetite for each particle. This model learns from each sample, improving over time as the washery operator feeds it data. Separation: Pneumatic air jets, calibrated to particle size, eject the waste stream in real-time. No slurry, no water loss, no density-dependent compromise. Key spec: Response time is 1.5 milliseconds. Belt speed allows ~220 tonnes/hour capacity on a standard-width sorter. This fits into existing washery flowsheets. Four case studies: Real data Case 1: SECL Washery, Chhattisgarh (Coal India) ROM coal grade: 45% ash (typical high-ash CIL coal). Recovery target: −1mm coal fraction currently reporting to tailings. Installed: XRT dry sorter, 200 t/h capacity.After 12 months: Coal recovery improved by 5.2% of feed (translates to ~10,400 tonnes/year for a 500 t/d washery). Tailings pond life extended by 18 months (1.3M cubic meters saved). Equipment wear was recovered in Capex: reduced due to smaller tailings volume and less stress on desliming screens.Economic impact: Coal recovered is valued at ~₹52 lakh/year. Capex: ₹2.5 crore, payback ~4.8 years. This figure excludes tangible benefits from reduced pond management. Case 2: BCCL Washery, Odisha (Captive Coal) Coking coal has lower ash (~32%), but the fine fraction is rich in coal. Recovery metric: Gangue-in-coal reduction (target: <1%).Results: Gangue in coal was reduced from 3.2% to 0.8% in the -10 mm fraction. Flotation cell washout time reduced by 40% (downstream benefit: less scrap, faster cycle). Magnetite recovery improved: 15% less magnetite loss in tailings.Economic impact: Coking coal grade premium recovered. At CIL captive pricing, this initiative results in a value uplift of ~₹38 lakh/year. Payback period is ~6 years, including O&M. Case 3: MCL Washery, Jharkhand (ROM Coal) High near-gravity material (NGM) coal has a density that overlaps with that of carbonaceous shale. Traditional washery: NGM reports to waste (20% of feed by weight). A dry sorter was applied to the -50 mm + 10mm fraction.Results: NGM partitioning accuracy: 88% of coal recovered from NGM-rich stream. Clean coal yield: +3.1% of feed. Water usage in dense media bath: reduced by 12% (lower volume of ore needing beneficiation).Economic impact: ₹44 lakh/year coal recovery value. Reduced water cost (important in Jharkhand water-stressed regions). Case 4: CCL Washery, West Bengal (Central Coalfields) Old washery (commissioned 1987): heavy media cyclone struggling with washability variability. Problem: Frequent changeover in ore source → recovery swings 80–85% depending on geology. Installed an XRT sorter upstream of the cyclone as a pre-concentration step.Results: Recovery stabilized at 92–95% regardless of ore source. Cyclone efficiency: improved (receiving pre-concentrated feed). Operator variance eliminated (machine vision removes subjectivity).Economic impact: ₹31 lakh/year improved recovery. Stability benefit: reduced process downtime during source changes (~5–7 days saved per year per changeover). Typical integration of sensor-based dry sorting into an existing coal beneficiation circuit. Why this engineering works for Indian coal Three reasons dry sorting hits harder in India than globally. First, CIL coal averages 35–45% ash, and this ash is dispersed (not layered), making density-based separation imperfect. XRT sees atomic number (coal is C; gangue is Si/Al), not just density. This is a structural advantage

Why 98% Recovery Rates Matter Read More »